Stress test of urban centres in the Buurserbeek-Schipbeek basin
The expected climate change will leave us facing extreme weather; temperatures are rising, and precipitation volumes are increasing, as is the frequency of extreme downpours. In addition, we will increasingly be faced with drought. In order to prevent future problems, it is important to factor in such considerations in current planning processes. For that reason, the Rijn en IJssel district water board is drawing up a draft water system perspective for the Buurserbeek-Schipbeek basin. This perspective outlines how the district water board envisages the development of the water system at the strategic level. In the purview of the perspective regarding urban centres, a stress test has been conducted aimed at waterlogging and heat stress.
The water system perspective being drawn up by the district water board constitutes the basis for a dialogue with local stakeholders. To substantiate the urban centres perspective, the district water board has commissioned Aveco de Bondt to conduct an analysis of the built-up areas in the Buurserbeek-Schipbeek basin. A model calculation of the areas when affected by extremely high downpours has identified waterlogging bottlenecks. A subsequent study has explored measures that could contribute to reducing these bottlenecks.
The model calculation was underpinned by an environmental model constructed for the four large centres of Markelo, Holten, Bathmen, and Neede, and the minor centre of Rietmolen. The Tygron engine was used to collect relevant open data, supplemented by information on the sewer system and the surface water system. Subsequent calculations based on three extreme downpours identified the locations that would be affected by waterlogging and the severity of the impact:
- Climate downpour: 60 mm in 60 min
- Apeldoorn downpour: 120 mm in 75 min
- Munster downpour: 220 mm in 90 min
For each of the centres, the percentage of inundated road surface was calculated, along with the floodwater depth; Figure 1 shows the result for the Markelo town centre. In addition, heat stress in these centres has been mapped out at the street level.
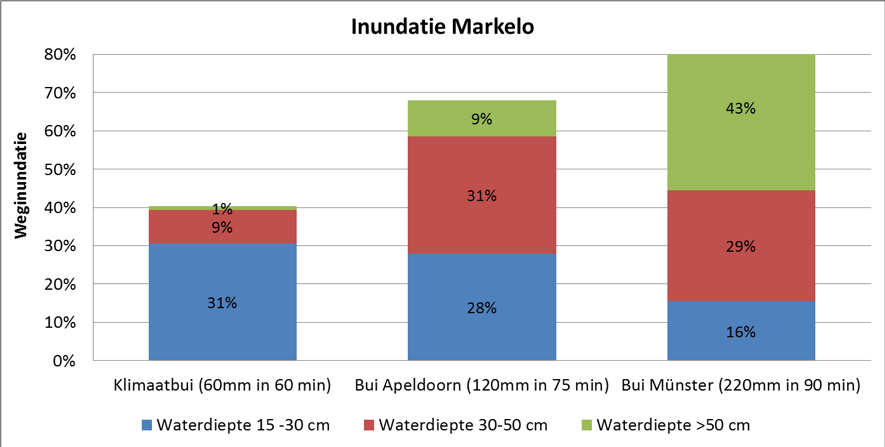 Figure 1: Extent of waterlogging in the Markelo town centre during several downpours
For each centre, the impact has been calculated of a large number of potential measures to reduce waterlogging (see Table 1). These included the retention and retarded discharge of water on roofs and at ground level; water storage in gardens, wadis, or underground; and the accelerated discharge of water at the surface level, via sewer overflows, and drainage canals. Subsequent calculations quantified how the measures would impact heat stress.
Table 1: Measures studied

The exploratory study has generated a thorough image of the effectiveness of the range of measures (see Figure 2). Even after implementation of the measures, 10 per cent of the roads will still be covered by 15 to 30 cm of water. However, the level of waterlogging will be considerably less compared to the situation before. Based on the experience gained, several sets of measures have been compiled for the various centres.
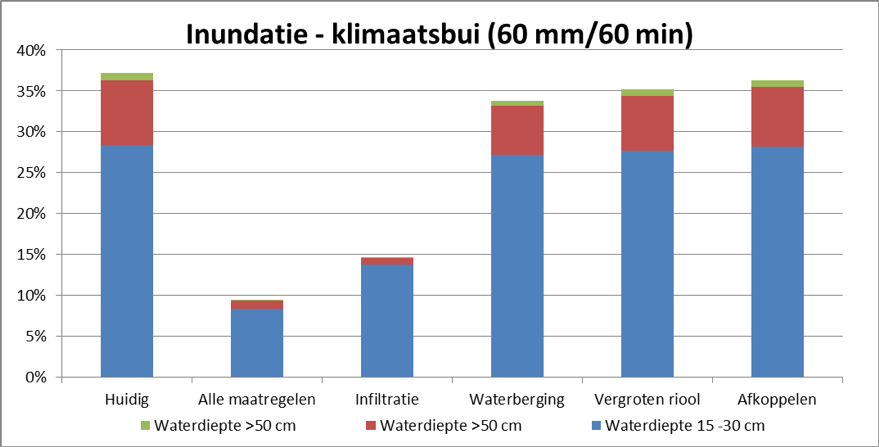
Figure 2: Reduction of waterlogging during a 60 mm/60 min climate downpour after implementation of a combination of all measures explored
The exploration of the measures has taught a number of lessons. Neighbourhoods with wadis appear to be quite capable of withstanding extreme downpours (see Figure 3). Virtually every centre features some local hollows that are highly prone to waterlogging. The areas at the foot of slopes are vulnerable as well. In extreme situations, it does not matter whether a sloping area is built-up or undeveloped. Furthermore, during extreme downpours, the embankments along the brooks that are intended to protect against flooding are likely to backfire because they hamper a free flow of water into the brook. Severe downpours will also significantly reduce overflow capacities, because surface water from rural areas will be under great pressure as well, causing counterpressure at sewer overflows.
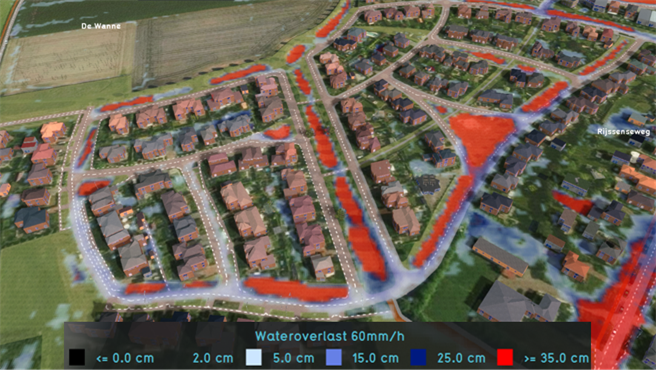
Figure 3: Effectiveness of wadis in a climate-proof neighbourhood during a 60 mm/h downpour. The wadis (red areas) store water; as a result, only some roads will be flooded (blue areas).
In terms of effectiveness of the measures, the greatest gains will be made by expanding infiltration (open pavements and infiltration crates). The “disconnection” measure turns out to be less effective in climate downpours (60 mm in an hour). However, it is worth noting in this respect that disconnection actually contributes to the improvement of surface water quality and boosts purification yield.
The quick analysis, conducted over two weeks, has generated a great deal of input for the water system perspective and constitutes a sound basis for the parties involved to set up a dialogue on the future. The concrete outcomes and lessons provide good guidelines for focusing on the main bottlenecks and most promising solution strategies.
Contact persons
Simon Troost
Aveco de Bondt
stroost@avecodebondt.nl
06 53 72 19 44
Rutger Engelbertink
Waterschap Rijn en IJssel
r.engelbertink@wrij.nl
031 43 69 737