NAS adaptation tool helps province of Utrecht to identify opportunities and bottlenecks
The climate portal of the province of Utrecht uses the NAS [National Adaptation Strategy] conceptual diagrams to show the opportunities and risks involved in each of the climate themes. Red circles indicate the risks, green circles indicate opportunities. How has the province of Utrecht used the NAS adaptation tool? We asked Ida Philip, climate adaptation policy assistant for the province of Utrecht.

For what purpose have you used the diagrams?
The province of Utrecht is using the NAS diagrams for its internal and regional dialogues:
- Internal dialogues: we are using the NAS diagrams to discuss, within our own policy fields, the impact of climate adaptation within the various policy fields, sectors, and projects;
- Regional dialogues: we are using the NAS diagrams to enter into a dialogue with the parties involved in the Working Regions, with the goal of collectively drawing up a Regional Adaptation Strategy. The diagrams are intended to make participants aware of the impact of climate change, and to collectively determine which effects have priority.
Why have you opted for using the diagrams?
The diagrams help to make the dialogues interactive. The interactive sessions are intended to get answers to the following questions:
- What do policy teams or participants know about climate adaptation?
- What ground does climate adaptation have in common with the participants’ fields of work?
- Has climate adaptation already been incorporated into the policy currently pursued?
With the NAS adaptation tool, we did not use the climate themes – drought, waterlogging, heat, and urban flooding – as our points of departure. Instead, we are taking our departure from the sectors, in order to have every party involved consider what opportunities and bottlenecks climate change is generating in terms of their own policy, field of knowledge, or project.
In what way have you used the diagrams?
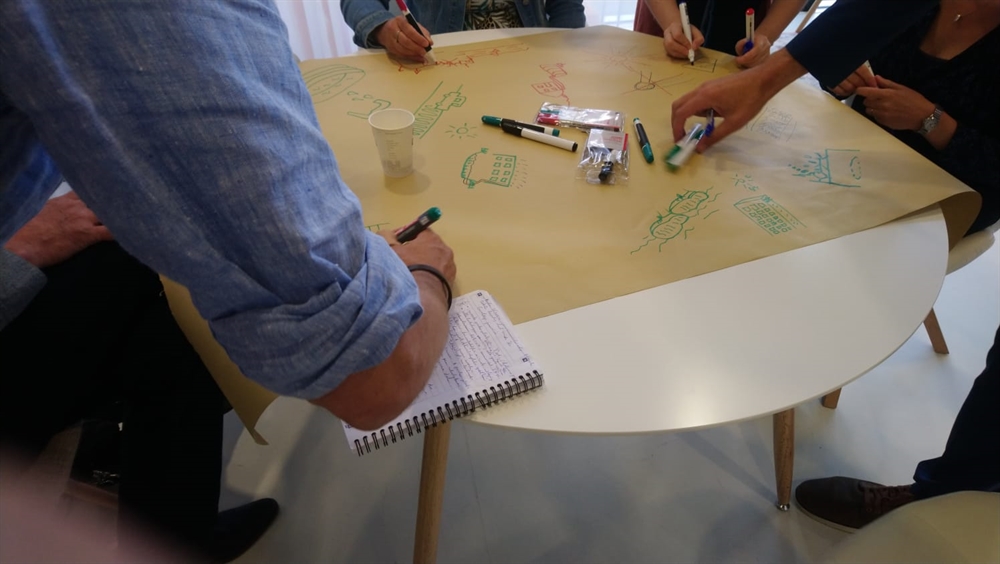
We are using the conceptual diagrams as our starting points for the sector-based dialogues. In each case, they are literally on the table. In some dialogues, they are inspiring the participants to come up with a host of opportunities and bottlenecks themselves. In other dialogues, the participants will look at all the conceptual diagrams, whereupon they use the step-by-step form (pdf, 162 kB) and the risk matrix (pdf, 843 kB) to determine which effects have priority and which are less urgent.
What exactly is your approach?
After a brief introduction on climate change and adaptation, we enter into a dialogue.
- First, we explore the topic using questions such as, “In your work, what do you notice in terms of climate adaptation?”
- Subsequently, we introduce the NAS diagrams. These show how complex the impact of climate change is.
- Then we resume the dialogue with questions relating to the NAS diagrams: do you recognise any of the effects reflected in the diagrams? Which effects are important to your own field of work or project?
As a minimum, the result of the sessions is that the participants become aware of the opportunities and threats that climate change entails for their own field of work. In some sessions, the participants collectively determine which opportunities and threats have priority, and which are less urgent. In conclusion, we ask who would be willing to be a climate adaptation ambassador, and we discuss the subsequent steps.
How do you determine which diagram circles are more, or less, relevant for your team?
The dialogue participants together determine which circles are relevant, i.e., where the opportunities and bottlenecks lie. Climate adaptation experts then enter into a dialogue with the representatives of policy fields, sectors, and projects involved.
What is the result?
In the dialogues, the conceptual diagrams can produce various results:
- They raise awareness;
- Opportunities and threats are adjusted: some diagram circles will be added, others will be removed;
- The participants use the diagrams and the risk matrix to determine which themes have priority and which are less urgent. This extends to both the risks and the opportunities. They elaborate these priorities into potential solutions (adaptation strategies), the involvement of stakeholders, and short-term actions.
How will you be using the conceptual diagrams next?
As yet we have been using the NAS diagrams per sector, but we also intend to use them for comprehensive risk dialogues. Each conceptual diagram will then cover multiple sectors, such as living, biodiversity, and health. Thus, the opportunities and bottlenecks between various sectors become manifest. This will enable us to define even more accurately which opportunities and risks take priority and which are important to provincial policy. Wherever possible, we will also be approaching potential solutions in an integrated manner.
Contact person
Ida Philip
Provincie Utrecht
ida.philip@provincie-utrecht.nl
