Oxygen content
Frequent low oxygen content (anoxia) or lack of oxygen (hypoxia) in a water system can cause stench, fish mortality and the growth of harmful blue-green algae. The paragraphs below explain more about the various control variables that affect the oxygen content of a water system. The table below shows how climate change can affect these control variables.

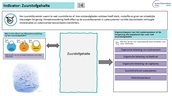
Screenshot from the knowledge document. Downloading the knowledge document (pdf, 13 MB) gives you access to the interactive pages.
Climate change affects the oxygen content of water systems through heat and waterlogging. In prolonged periods of heat, the water temperature will rise, and the oxygen concentration will fall. One reason is that the organisms in high-temperature water use more oxygen. In addition, the demand for oxygen can increase if severe downpours are causing sewer overflows. This can result in hypoxia, which will cause the death of fish and small water creatures.
Effect of control variables on oxygen content
The most important control variables that may impact the oxygen content are:
A sewer overflow is an opening in a combined sewage system that allows the discharge of excess sewage water onto surface water during severe and prolonged rainfall. Sewer overflows can cause temporary and sharp increases in the organic load of a water system, as a result of which the oxygen concentration will drop. In some cases, this will lead to organism mortality. The organic load rate depends on three variables: the volume of sewage water ending up in the water system, the frequency of sewer overflows and the concentration of organic matter. The concentration of organic matter will be lower if the sewer overflow is equipped with a storage settling tank where dirt will settle before a proportion of the water flows on to surface water. Surface water in the vicinity of a combined sewer overflow that regularly runs over is highly vulnerable to a decrease in oxygen concentration. Surface water a relative distance away from a combined sewer overflow or near an overflow that runs over only occasionally will be moderately vulnerable. Surface water connected to a separated sewage system or not connected to a sewer overflow is not vulnerable.
On the waterbed, leaves shed by trees surrounding a water system form a layer of slowly decomposing organic matter. The volume of leaves falling onto a watercourse will depend on the distance between the trees and the watercourse, the tree species and the municipal management. A thick layer of leaves on the waterbed fosters a high, relatively constant demand for oxygen, particularly between April and September. Depending on the volume of leaves and the duration, this may cause organism mortality. A water system will be highly vulnerable to leaf fall if more than 50 per cent of the waterside contains trees shedding leaves onto the water. If 25 per cent to 50 per cent of the waterside contains such trees, the water system will be moderately vulnerable. A waterside without any trees means that the water system is not vulnerable.
Some urban areas are home to large numbers of water birds. If such birds are fed, large volumes of organic matter can end up in the water, either directly through droppings falling in the water, or indirectly via rainwater runoff. At certain locations, this can lead to a high, relatively constant demand for oxygen. Depending on the volume of bird droppings and the duration of the birds’ stay, this can cause organism mortality. A water system that regularly accommodates more than twenty geese or other water birds and whose watersides are covered in droppings will be highly vulnerable to the inflow of bird droppings. If the groups of water birds are smaller and the watersides feature few droppings, the system will be moderately vulnerable to the inflow of bird droppings. A water system will not be vulnerable if it does not accommodate water birds and if its watersides do not feature any droppings.
Aquatic plants consume oxygen during the night and produce oxygen by day (photosynthesis). This results in a natural oxygen dynamic, in which the oxygen concentration is lowest at night and highest by day. A surface layer of aquatic plants will cause low-oxygen conditions in the water. If the surface is covered to a large extent for a prolonged period of time, organism mortality may ensue. A water system in which 50 per cent of the surface is covered in aquatic plants will be highly vulnerable to this effect. A water system covered by less than 10 per cent is not vulnerable. Coverage between these two percentages means that the system is moderately vulnerable.
Higher water temperatures will accelerate decomposition processes, which means that more oxygen will be used per unit of time. Particularly in water systems containing much organic matter, this can result in low oxygen concentrations. Depending on the proportion of organic matter and how long the water remains warm, this can cause organism mortality. A water system with a temperature in excess of 25°C is highly vulnerable. Water temperatures between 20°C and 25°C render the system moderately vulnerable. A temperature lower than 20°C means that the system is not vulnerable with respect to this control variable.
In part, the vulnerability of a water system to these different control variables depends on its use. Is the water used for swimming, as cooling water, as drinking water or for irrigation? The limiting values differ for each functional use and also differ per water system. The Urban Water Quality, Climate and Adaptation Tool indicates approximate limiting values for the control variables outlined above. These limiting values are not geared to a water system and can, therefore, only be used on an indicative basis.
Effect of climate change on the control variables
The table below shows how climate change impacts the various control variables that together determine the nutrient content of a water system. For example, the table reflects that increasing waterlogging causes more sewer overflows, which may have a negative effect. At the same time, sewer overflows are decreasing as a result of the increasing drought, which is a positive effect. More information can be found in the Excel file on Functional Uses of Water Types (xlsx, 499 kB). The table below has been derived from a table in this file, which is contained in sheet “Effects of climate change”, part C.
| Control variables | Heat | Waterlogging | Drought | Watersafety |
|---|---|---|---|---|
| Organic loading via sewer overflow | Increase, negative | Decrease, positive | ||
| Organic loading via leaf fall | Increase, negative | |||
| Organic loading via bird droppings | Increase, negative | Increase, negative | Decrease, positive | |
| Oxygen use of aquatic plants | Increase, negative | |||
|
Water |
Increase, negative |
Are you interested in the quantitative effects per water system? These can be determined using the calculation tool, the Guide to Water Quality Stress Tests. Climate change and water quality, developed by the Foundation for Applied Water Research (STOWA). Or use this guide to draw up a detailed water and substances balance based on climate prognoses. Through-flow, also referred to as retention time, is an input parameter that affects ecological quality.
