Salt content
The salt content of a water system determines which aquatic flora and fauna it will feature. If the volume of salt in surface water increases, salinisation will occur. Salinisation may pose problems for nature, farming, industry and drinking water companies. In some cases, farmers or nature management bodies will even need to convert to other crops or pursue other types of natural systems. The paragraphs below explain more about the various control variables that affect the salt content of a water system. The table below shows how climate change can affect these control variables.
Especially in coastal areas, climate change is leading to increased salinisation. Contributing factors are, e.g., the rising sea level, soil subsidence and changes in river discharge volumes. As a result, more and more saltwater seepage is entering freshwater systems, whilst river counterpressure is changing. Drought and heat can also cause salinisation of surface water. For example, in periods of drought, foreign water from the major rivers is occasionally let in, whilst such water may have quite high salt contents. In addition, more water tends to evaporate during warm periods, thus raising the salt content of the water even more.
Impact of control variables on salt content
The most important control variables that can affect salt content are:
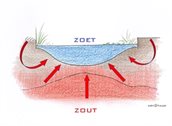
In part, the vulnerability of a water system to these different control variables depends on its use. Is the water used for swimming, as cooling water, as drinking water or for irrigation? The limiting values differ for each functional use and also differ per water system. The Urban Water Quality, Climate and Adaptation Tool indicates approximate limiting values for the control variables outlined above. These limiting values are not geared to a water system and can, therefore, only be used on an indicative basis. With respect to salinisation issues, it should be noted that large parts of our coastal zone used to be saline. Therefore, artificial systems are developing, featuring a saline waterbed and fresh supply water. Are you interested in finding out more about how to deal with this freshwater-saltwater dynamic? Helpful information is provided in the Freshwater-Saltwater Dynamic Assessment Framework on the website of the Foundation for Applied Water Research (STOWA).
Effect of climate change on the control variables
The table below shows how climate change impacts the various control variables that together determine the nutrient content of a water system. For example, the table reflects that increasing waterlogging causes more sewer overflows, which may have a negative effect. At the same time, sewer overflows are decreasing as a result of the increasing drought, which is a positive effect. More information can be found in the Excel file on Functional Uses of Water Types (xlsx, 499 kB). The table below has been derived from a table in this file, which is contained in sheet “Effects of climate change”, part C.
| Control variable | Heat | Waterlogging | Drought | Water safety |
|---|---|---|---|---|
| Saltwater wedge | Increase, negative | Increase, negative | ||
| Inlet of surface water | Increase, negative | Decrease, negative | Decrease, negative | |
| Seepage | Increase, negative | Decrease, positive | Increase, negative |
Are you interested in the quantitative effects per water system? These can be determined using the calculation tool in the Guide to Water Quality Stress Tests. Or use this guide to draw up a detailed water and substances balance based on climate prognoses. Are you interested in finding out more about how to deal with this freshwater-saltwater dynamic? Helpful information is provided in the Freshwater-Saltwater Dynamic Assessment Framework on the website of the Foundation for Applied Water Research (STOWA).