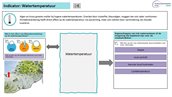
Water temperature
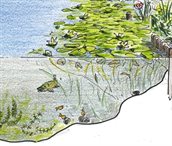
Higher water temperatures accelerate biological processes. In such circumstances, algae and duckweed grow faster, whilst issues arising from fish mortality, blue-green algae and mosquitoes may occur more frequently. Furthermore, the temperature can cause reproductive issues. The paragraphs below explain more about the various control variables that affect the temperature of a water system. The table below shows how climate change can affect these control variables.
Climate change has a direct effect on water temperatures during periods of heat, when the water will heat up. In addition, climate change and water temperatures are interrelated in an indirect manner: during drought, seepage pressure will decrease, resulting in less cold water coming up from the soil.
Impact of control variables on water temperature
The most important control variables that may impact water temperatures are:
How vulnerable a water system is to these different control variables depends, among other things, on what it is used for. Is it used for swimming, as cooling water, for drinking water, or for irrigation? Each function has its own threshold values, which also differ from one water system to another. The Urban Water Quality, Climate and Adaptation (SWKA) tool provides an approximate set of threshold values for the different control variables mentioned above, for various functions. These threshold values are not tailored to any specific water system and can therefore only be used as an indication.
Effect of climate change on the control variables
The table below shows how climate change impacts the various control variables that together determine the nutrient content of a water system. For example, the table reflects that increasing waterlogging causes more sewer overflows, which may have a negative effect. At the same time, sewer overflows are decreasing as a result of the increasing drought, which is a positive effect. More information can be found in the Excel file on Functional Uses of Water Types (xlsx, 499 kB). The table below has been derived from a table in this file, which is contained in sheet “Effects of climate change”, part C.
| Control variable | Heat | Waterlogging | Drought | Watersafety |
|---|---|---|---|---|
| Depth | Increase, negative | Decrease, negative | ||
| Incidence sunlight | ||||
| Supply of cold seepage wate | Increase, positive | Decrease, negative | Increase, positive | |
| Air temperature | Increase, negative |
Are you interested in the quantitative effects per water system? These can be determined using the calculation tool, the Guide to Water Quality Stress Tests. Climate change and water quality, developed by the Foundation for Applied Water Research (STOWA). Or use this guide to draw up a detailed water and substances balance based on climate prognoses.