NAS Adaptation Tool
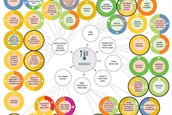
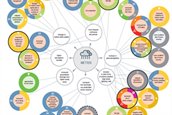
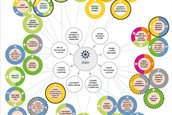
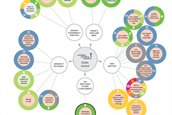
In the National Climate Adaptation Strategy (2016), the impact of climate change is visualised in four conceptual diagrams. These conceptual diagrams present a visual summary of current scientific knowledge on the direct effects and the indirect consequences of increasing heat, precipitation, drought, and sea level rise. In 2018, the NAS Adaptation Tool was launched to enable users to compile their own conceptual diagrams, in order to gain insight into the opportunities and risks that climate change entails for their own issues or field of work. In March 2021, the NAS Adaptation Tool was updated. This page comprises a brief explanation of the tool. It also contains the latest versions of the national conceptual diagrams.
How do you use the NAS Adaptation Tool?
Would you like to make a customised conceptual diagram? Then go to the NAS Adaptation Tool. In three steps, you can compile a selection of climate trends and sectors. For example, you can choose the heat and drought trends in the sectors of infrastructure, energy, and IT/Telecom. You also have the choice of reflecting only major consequences or medium consequences as well. You may also choose to only reflect the opportunities, or only the threats. Once you have compiled your selection, you can remove circles or move them across the screen. As a final step, you can export the conceptual diagram as an image, PDF file or database, e.g., to print it as a poster or to add it to a presentation or publication. You may also add your own impact circles using the Adobe Illustrator software.
National conceptual diagrams
The most recent versions of the conceptual diagrams are presented below (source: NAS implementation programme 2018-2019).