Climate Impact Atlas
Would you like to find out how climate change will impact your area? For example, are you – in your capacity as municipal staff – working on a climate stress test for your municipality? Or would you like to find out where in your region the increasing heat poses a risk for vulnerable elderly residents? The Climate Impact Atlas provides a first impression of the impact of climate change on the individual municipalities and regions in the Netherlands. The Atlas comprises four elements: the map viewer, map narratives, climate scenarios and the neighbourhood dashboard.
For whom?
The Climate Impact Atlas is of use to anyone interested in finding out more about the consequences of climate change in an area, i.e. not just to public authorities, but also, for example, to educational establishments, students, businesses and local residents.
How can it be used?
The Climate Impact Atlas provides a first impression of the potential current and future effects of climate change on the Netherlands. Thus, the Atlas is an excellent starting point for local and regional government authorities embarking on a climate stress test. However, it also contains maps that provide some context, such as soil maps and maps identifying potential opportunities. The possibilities offered by each element are listed below.
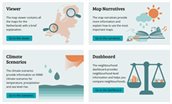
- Map viewer: the viewer contains different types of maps that show the potential consequences of waterlogging, drought, heat and flooding for your area. Other maps show how climate change may impact the water quality in your area.
- Map narratives: the map narratives provide explanations of the main maps. They tell you what is shown on the maps and help you get started with the information.
- Climate scenarios: the climate scenarios show how heat, drought, waterlogging and sea level rise will develop in the Netherlands if the climate continues to change. This tool is based on the KNMI’23 climate scenarios.
- Neighbourhood dashboard: the neighbourhood dashboard provides rapid insight into the climate resilience of neighbourhoods. For example, it shows how green a neighbourhood is or how high the perceived temperature will be on a summer's day.
Who has developed the Atlas?
The Climate Impact Atlas is coordinated and managed by Climate Adaptation Services, under the authority of the Ministry of Infrastructure and Water Management. The map info in the Atlas is developed in collaboration with various research institutes and consultancies.
Date of publication
2012, most recent update in 2024
