Climate-proof City Toolbox
Which climate adaptation measures are effective? What locations are appropriate for such measures? And what will such measures cost? The Climate-proof City Toolbox can be used to explore dozens of adaptation measures for your neighbourhood, street, or premises.
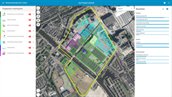
What does the tool show?
The toolbox shows how effective various measures are in a particular area that is faced with waterlogging, drought, or heat. First, you select several measures, which you draw on the map. Subsequently, the tool shows how effective the selected measures will be, for example, by indicating the additional water storage that will be created by a particular measure, or how much it will reduce heat stress. The tool also provides a cost estimate of the measures.
In December 2019, a new version of the Climate-proof City Toolbox was launched. This new version is more user friendly, allows you to add your own map layers, and provides better insight into the effectiveness of adaptation measures.
How can you use the tool?
You can use the Toolbox individually or as a collective basis for a risk dialogue or joint design sessions. It can be used to quickly draw up various scenarios and compare them to climate adaptation goals set earlier.
Do you wish to use the tool?
Would you like to get going with this tool? Go to the Climate-proof City Toolbox. Please note: the tool only operates with the Chrome, Microsoft Edge, Safari, and Firefox browsers. The tool does not work in Internet Explorer! The website also features a manual and other background documents. Do you have any questions or comments regarding the tool? Please forward your response to the Spatial Adaptation Helpdesk.