Drought Chain
Drought features various interrelated causes and effects. Ergo, drought involves a complex issue. It is more complicated than waterlogging, flooding, and heat. In order to be able to take proper measures to reduce the impact of drought, we need to gain more insight into this chain of causes and effects. The Drought Chain (in Dutch) is a helpful tool in this respect.
For whom?
The Drought Chain is intended for:
- Professionals, either working on behalf of the government or working within other organisations
- Educators and students
How can the Drought Chain be used?
The Drought Chain can be used for various purposes. Some examples:
- The Drought Chain helps to gain insight into drought issues affecting a particular area. Selecting the type of landscape featuring in your area enables you, for example, to use the Drought Chain as the starting point for a stress test.
- Is your sector facing an issue that is caused by drought? In that case, the Drought Chain will enable you to find out, step by step, which effects are causing this issue and what their meteorological causes are.
- The Drought Chain can help to identify potential measures to be taken by the parties involved in order to mitigate drought-related issues.
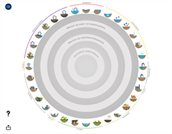
What does the visualisation show?
From the outside in, the circle shows the following.
- The outermost border represents the various sectors. Each sector shows one or more impacts: the little icons in the outermost ring of the circle. For example, with respect to Living and Working, the Drought Chain features six impacts, versus only one impact pertaining to Industry.
- The innermost ring shows the potential meteorological causes of drought. Climate change may add to the frequency with which these meteorological conditions occur.
- The ring around it shows the potential effects on the availability of water.
- The last ring shows the potential impact on the water and soil system.
Clicking on an impact will display the interrelationships between the various causes and effects. Each of these causes and effects may also be clicked on. The upper right-hand corner will show more information on the cause or on the effect selected. Click on “More information” to find out more on solution strategies, parties that may implement measures, and types of landscape that are prone to an impact or an effect.
How does the filter work?
To the right of the circle, you will find a feature enabling you to apply filters to the Drought Chain. Thus, you can examine causes and effects that affect your area only, or that are only relevant to certain parties. For example, is your area composed entirely of river areas, river terraces, and lateral moraines? Then ensure that only such types of landscape are checked, whilst the other types of landscape are unchecked. Would you like to focus on certain parties, for example, regional water authorities and drinking water companies, to view what measures they can take to combat drought issues? Then uncheck all the other parties, leaving only those two checked. All the parties and all the landscape types are checked by default.
How do you use the Drought Chain?
How you use the Drought Chain depends on what you intend to achieve with it. It is primarily an educational instrument enabling you to decipher how the causes and effects of drought are intertwined. Above, we listed three purposes. The paragraphs below explain how to use the Drought Chain for each of these purposes.
Would you like to gain insight into drought issues affecting a particular area?
In order to gain insight into the drought issues affecting your own area, the Drought Chain is used as follows:
- Go to the filter to the right of the visualisation. Ensure that only the landscape types featuring in your area are checked. As all the landscape types are checked by default, this requires you to uncheck all the other types of landscape.
- The outer ring of the circle will now display the impacts that may affect your area.
- Direct your mouse to an impact to view the direct effect or effects causing the impact.
- To find out more on the underlying causes of an impact and their interrelationships, click on the icon for that impact.
- Click on the various effects and their causes to view how they are interrelated.
- To find out more on an impact, a cause or an effect, click on “More information”. This will produce a box containing information on potential measures, parties that are capable of implementing such measures, and types of landscape that are prone to the impact or effect.
- To view another impact, you first need to click outside the ring.
Would you like to gain insight into drought issues affecting a particular sector?
In order to gain insight into the drought issues affecting your own sector, the Drought Chain is used as follows:
- In the outermost ring, go to your own sector. The icons that fall under your sector reflect the potential ways in which drought can impact the sector.
- Direct your mouse to an impact to view the direct effect or effects causing the impact.
- To find out more on the underlying causes of an impact and their interrelationships, click on the icon for that impact.
- Click on the various effects and their causes to view how they are interrelated.
- To view the impact only on particular landscape types or particular parties involved, use the filter on the right to uncheck or check landscapes or parties.
- To find out more on an impact, a cause or an effect, click on “More information”. This will produce a box containing information on potential measures, parties that are capable of implementing such measures, and types of landscape that are prone to the impact or effect.
- To view another impact, you first need to click outside the ring.
Would you like to know what potential measures can be implemented by a particular party?
To find out what a particular party can do to reduce the impact of drought, the Drought Chain is used as follows:
- Go to the filter to the right of the visualisation. Ensure that only the party required to or intending to take action is checked. As all the parties are checked by default, this requires you to uncheck all the other parties.
- In the outermost ring, you will now only see the impacts that are addressable by that party.
- Direct your mouse to an impact to view the direct effect or effects causing the impact.
- To find out more on the underlying causes of an impact and their interrelationships, click on the icon for that impact.
- Click on the various effects and their causes to view how they are interrelated.
- To find out more on an impact, a cause or an effect, click on “More information”. This will produce a box containing information on potential measures, parties that are capable of implementing such measures, and types of landscape that are prone to the impact or effect.
- To view another impact, you first need to click outside the ring.
Who has developed the Drought Chain?
Deltares research institute is responsible for the contents of the Drought Chain. The contents are based on a wide range of publications on drought, dating from recent years. Foundation CAS has developed the visualisation. The Drought Chain was commissioned by the Dutch Ministry of Infrastructure and Water Management.
Date of publication
April 2022